



















Sabres and Senators: Analyzing the PDO Regression and Crease Disparity
Buffalo and Ottawa navigate key roster absences and statistical volatility as they battle for Atlantic Division positioning. We break down the underlying metrics driving the market.
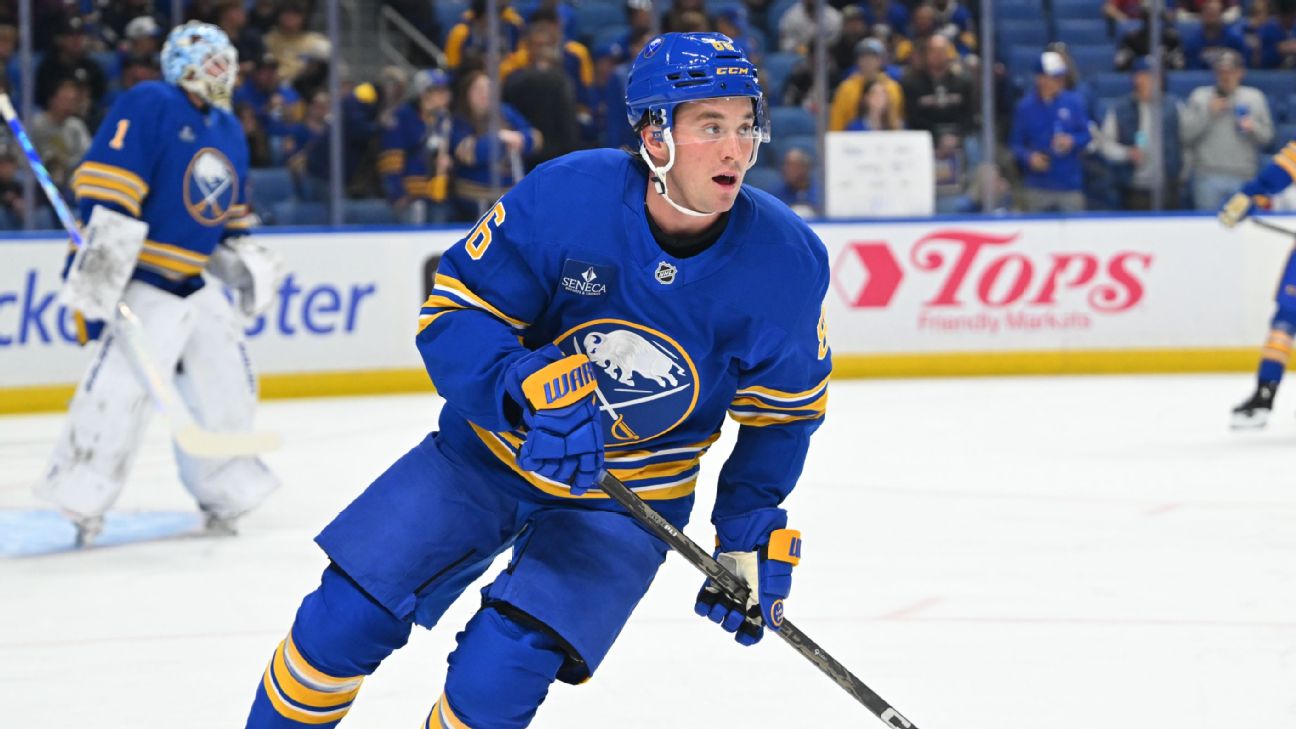
- ▪The Ottawa Senators are currently riding a 101.6 PDO, suggesting a significant negative regression is likely as their unsustainable puck-luck heater cools off.
- ▪Buffalo's 98.6 PDO indicates they are the primary 'buy-low' candidate, as their finishing and save percentages are statistically likely to trend upward.
- ▪The Senators hold a massive edge in shot differential (+370.0), yet their 29th-ranked penalty kill remains a liability that limits their overall special teams net index.
The Atlantic Division landscape remains as volatile as the underlying analytics suggest, with the Buffalo Sabres and Ottawa Senators providing a perfect case study in statistical variance. While Ottawa currently maintains a 10-6 record, their 101.6 PDO—a composite of shooting and save percentages—signals an inevitable regression. In contrast, Lindy Ruff’s Sabres are currently mired in a 98.6 PDO, which acts as a classic 'buy-low' indicator for sharp observers. The Sabres have been snakebitten, failing to convert on high-danger chances that their 88.7 finishing grade suggests should be finding the back of the net with greater frequency.
The market for these teams is shifting as bettors account for roster attrition and the reality of the schedule. While no single-game spread is currently live, the futures market reflects the skepticism surrounding both clubs, with Ottawa priced at +2800 and Buffalo at +3500 to win the Stanley Cup *(lines courtesy of YouWager.lv)*.
Possession Metrics and the 5v5 Shot Share Divide
Ottawa’s dominance in shot share is undeniable, boasting a 49% Corsi proxy that has yielded a massive +370.0 shot differential, ranking them 4th in the NHL. Under Travis Green, the Senators have mastered the art of forecheck disruption, utilizing a physical approach that has generated 1,953 hits, the third-highest total in the league. However, this high-volume style has not translated into defensive stability. Their 3.06 goals-against average highlights a crease vulnerability, compounded by the injury absence of Linus Ullmark, which forces Samuel Ersson and Jonas Johansson to carry a heavy workload behind a defensive unit that often sacrifices structure for aggression.
Buffalo, meanwhile, maintains a more balanced 50.5% SF% but struggles with possession consistency, evidenced by a league-worst 45.2% faceoff win percentage. With Peyton Krebs leading the top-six center rotation and Rasmus Dahlin anchoring the blue line, the Sabres have shown they can control play in spurts. Yet, the absence of Matt Grzelcyk due to a lower-body injury has forced Olen Zellweger and Mattias Samuelsson to absorb more minutes, testing the depth of a unit that already ranks 20th in blocked shots. The Sabres rely heavily on Ukko-Pekka Luukkonen to bail them out, as their 91.4 goaltending grade is the only thing keeping them competitive in high-event games.
Special Teams and the Sustainability of Success
Special teams remain the great equalizer in this matchup. Ottawa’s power play is lethal, clicking at 24.0% (8th in the NHL), but their penalty kill is a glaring weakness at 75.8%. When the Senators take penalties, they frequently surrender momentum, a trend that is unsustainable for a team with playoff aspirations. Buffalo’s special teams net index of 101.4% is far more balanced; while their power play lags at 19.5%, their 81.9% penalty kill is a top-five unit in the league. This defensive discipline on the kill is what allows Lindy Ruff to keep games close even when the Sabres are struggling to generate sustained 5v5 zone pressure.
Stop Betting Into Numbers After the Best Price Is Already Gone.
By the time TV shows talk about a game, the spread has already moved off the key number. See where the lines opened, where they sit now, and which hooks are worth waiting for.
The goaltending disparity is the final piece of the puzzle. Ottawa’s save percentage of .898 is respectable, but their PDO of 101.6 indicates they are benefiting from a level of puck luck that rarely persists through an 82-game season. Buffalo’s .880 save percentage is arguably the team's greatest statistical anomaly, as their defensive structure under Ruff is fundamentally sounder than the raw numbers suggest. As the Sabres look toward their next matchup against Columbus, the focus remains on whether they can force opponents into high-turnover scenarios, given they are already tied for 4th in the league with 413 takeaways.
- Buffalo's 98.6 PDO signals positive regression potential, making them a prime value target in the Atlantic Division.
- Ottawa's 29th-ranked penalty kill (75.8%) creates a massive vulnerability against structured power-play units.
- The Sabres' 45.2% faceoff win rate is a critical anchor point that forces their defense to play extended shifts in their own zone.
Market Positioning and Betting Verdict
When evaluating the futures market, the divergence between the Sabres and Senators is clear. Ottawa is currently priced as a more viable contender, but that valuation is heavily inflated by their recent, high-PDO run. Sharp bettors are looking at the underlying metrics—specifically the shot differentials and the special teams net index—to determine when to fade the Senators and when to back the Sabres as they move toward the middle of the season. Understanding how to weigh these metrics is essential for long-term profitability, especially when considering Evaluating Roster Depth: The 'Next Man Up' Reality.
Ultimately, the betting market at YouWager.lv offers the best environment to capitalize on these discrepancies. Because they provide lower hold percentages and sharper, more reactive lines, bettors can find value on the Sabres' puck line or total markets before the rest of the public catches on to the PDO regression. Avoid chasing the headlines surrounding Ottawa's recent wins; instead, focus on the statistical reality that their 101.6 PDO is destined to dip. For the Sabres, keep an eye on the injury report for Grzelcyk and Lyon, as their return will provide the necessary depth to stabilize the crease and improve their 98.6 PDO standing.
